Hi there, Do you like candlestick patterns?
I mean, what's not to like about it? They stand the test of time. They're universal (work on every symbol and every time-frame).
And they're very useful at fine-tuning your entries and exits. And they're versatile: There are Reversal and Continuation and Exhaustion patterns. Each of these patterns gives you insight into what the market trend is likely to do next (continue or weaken or reverse).
But the reality is:
There are not a lot of traders who actually use candlestick patterns every day as we would think.
Why? The problem is:
1. If you want to use candlestick patterns effectively, you need to learn the definition of 30+ patterns. And you need to quickly identify the pattern when it shows up on your chart. Takes a lot of time and practice.
2. Even if you've managed to learn all the patterns, then every day you have to manually go through every pair and every time-frame to find these patterns. It's a tiring routine.
But don't fret...
If you want to eliminate all the stress, frustration, and overwhelm you feel scanning the markets manually for candlestick patterns, here's the good news...
Let our "Candlestick Dashboard"
indicator do all the heavy lifting and
identify 30+ powerful candlestick
patterns for you...
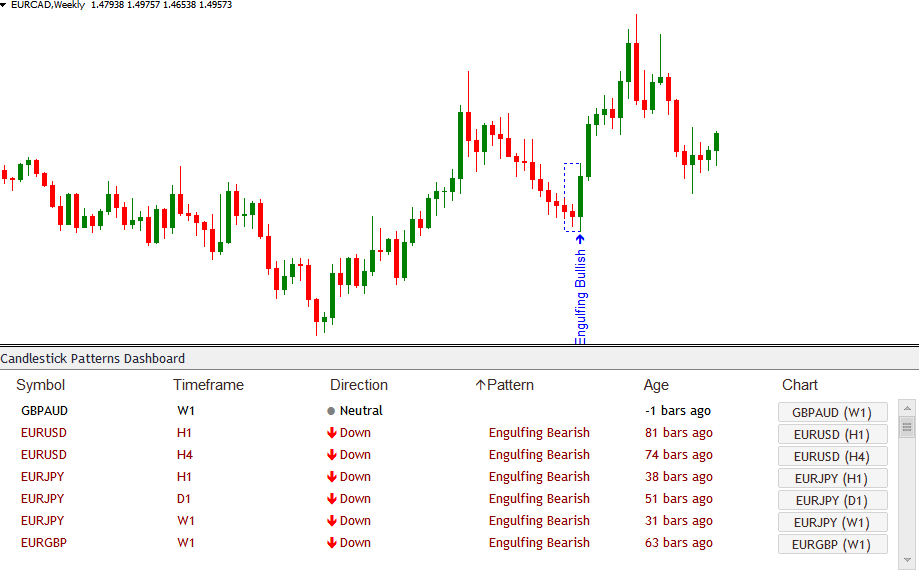
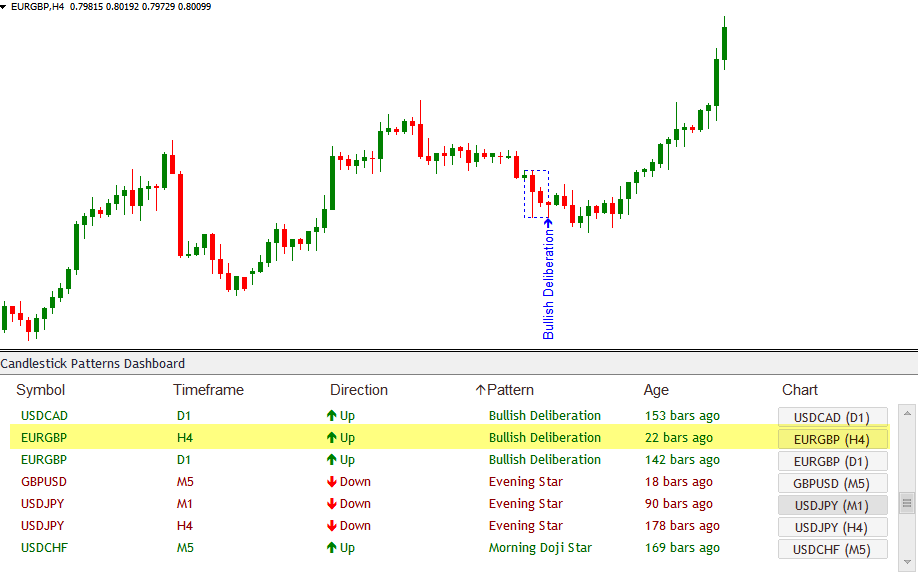
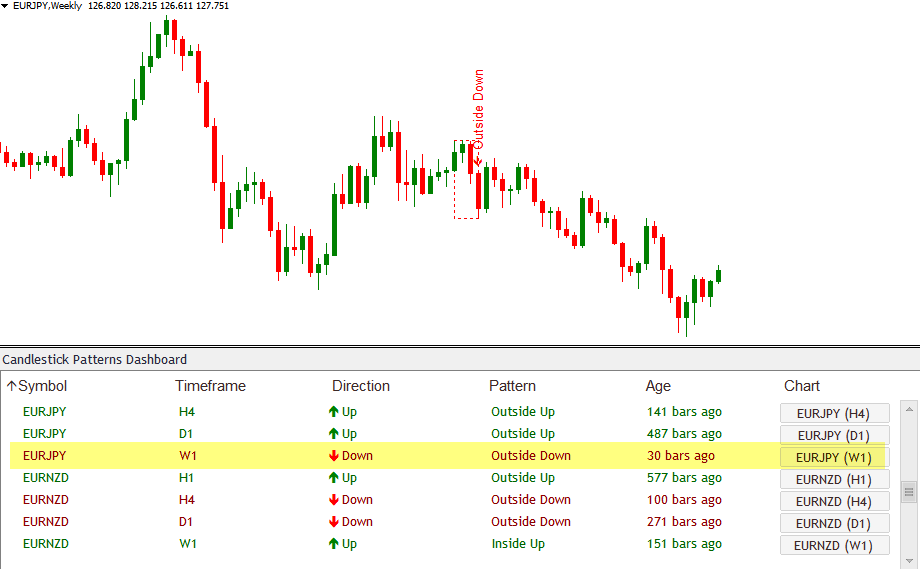
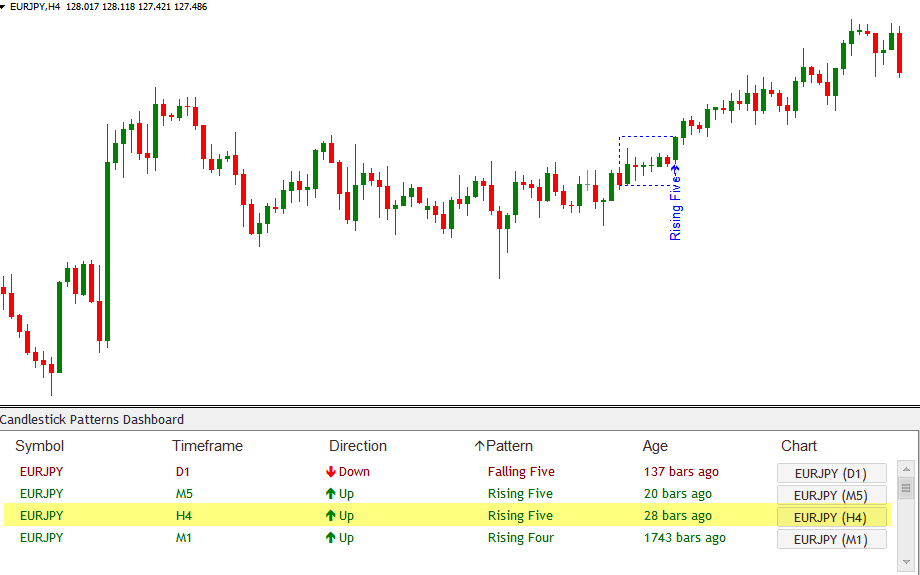
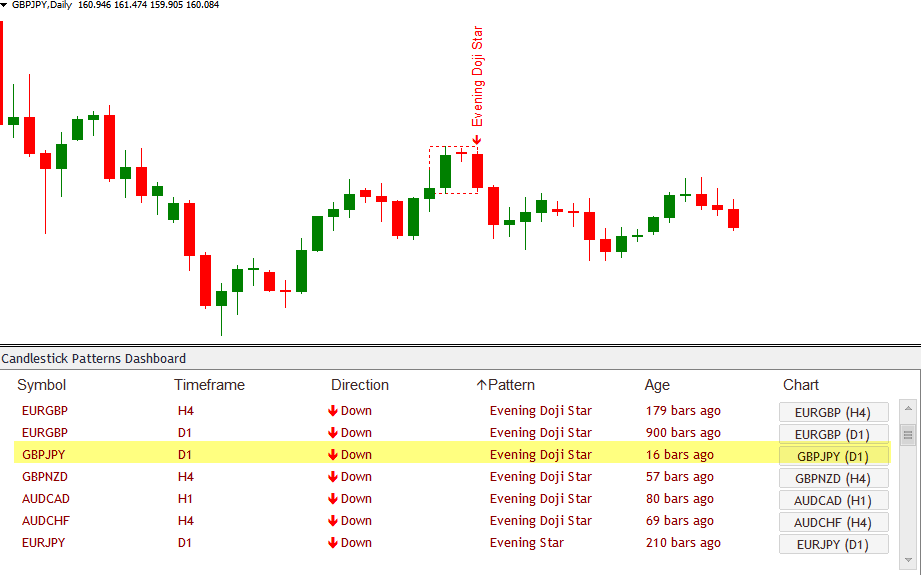
First, it will scan ALL currency pairs and ALL time-frames for over 30 powerful candlestick patterns. And all these calculations are done so fast - literally within seconds - you won't even notice the time. Then, the indicator will display a beautiful dashboard on your chart where you can see exactly what candlestick pattern has recently formed on EVERY pair, EVERY time-frame.
With just one look at the dashboard, you'll instantly know all the information you need to make a good trading decision. You'll instantly know which candlestick pattern appears on every timeframe (from 1-minute to monthly) and on every currency pair. Not only that, you'll also know the exact direction of that pattern - whether it's bullish or bearish. And you'll know exactly how long ago that particular pattern showed up.
Remember, you can specify as many pairs as you like. You can also use it for indices, stocks, futures, and gold (anything your broker offers in Metatrader). Our Candlestick Dashboard will take care of it all.
But maybe the most useful feature of the Candlestick Dashboard indicator is... Click on the symbol you want, and the indicator will open up that symbol chart with the Candlestick pattern highlighted... That way, you can look at the dashboard first to see the overall picture across multiple time-frames. Then once you identify a pattern that you want to trade, just click on the symbol to open up the relevant chart, so you can analyze the pattern further.
And by the way, did you know that... You can sort the dashboard in any way you like -- based on Symbol, Timeframe, Direction, Pattern, or Age...


.gif)